Harry Truman once asked for a one-handed economist. When asked why, he said because every economist he talks to gives an opinion and then says, “on the other hand”. He also commented that you could add up all the economists in the world and never reach a conclusion!
I have enjoyed economics as it was my undergraduate major in college. I love looking at charts and graphs and trying to dissect what happened and what is going to happen in the future. The field is quite humbling. I once sat in a meeting with our bank economist in 2004. He stated that the entire field of economics can be boiled down to four words, “people respond to incentive”. That is so true and very profound. At the same time, it made me wonder what all four years of undergraduate work was for if I could have just had the summary from the get-go.
This piece will examine a little of the “on the other hand” and “people respond to incentive”. It is a commonly accepted axiom in economics that the Federal Reserve Bank attempts to balance price stability (or low inflation) with employment growth. If there is no sign of inflation, the Fed will spur on economic growth with lowering interest rates or other accommodating monetary policy. If the economy is hot and prices are spiking up, they will try to cool off the economy with rising rates. So, the principal is rising rates suppress inflation.
But what if that is not the case? What if once the Fed begins to rise rates, what if people change their behavior to try to get ahead of the cycle by increasing their borrowing and spending. These actions will accelerate inflation.
To the charts, Batman! On the first one, note the Fed began to increase rates in the middle of 1977. The Consumer Price Index (CPI) was at a hot 6.5-7%. As the Fed increased rates from 7.5% to 17.5%, the CPI increased from 6.5% to 14.75%.

In this case the CPI did not drop until mid-1980 when the Fed cut rates from 17.5% to 9%. In the next one, note that bank lending was strong at a growth rate of 8-9% annually. CPI rose with every fed funds increase. Fed increases started in March and the CPI shot up in June.

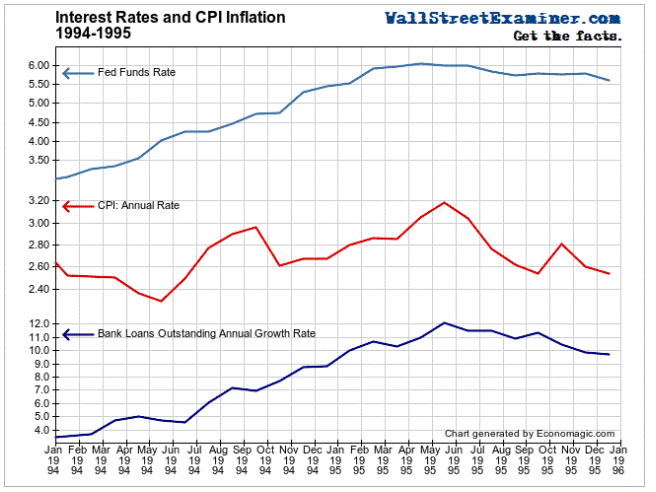
In this case, the increase in the CPI ran alongside the fed funds increases. The next one is from 1994-1995. Here increases in interest rates followed again with the increases in the CPI and also increased bank lending, substantially.
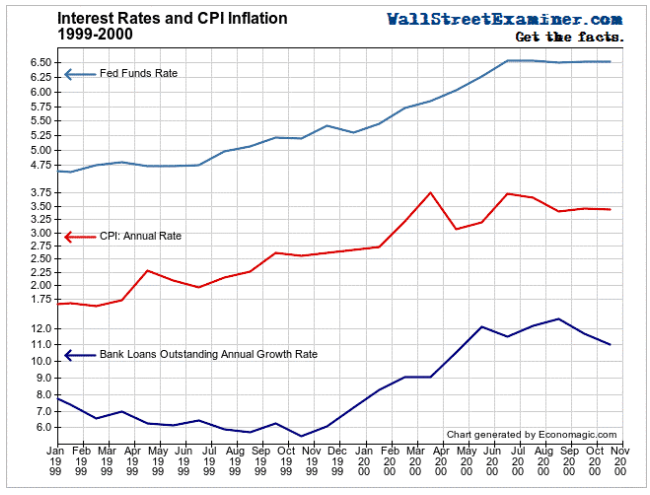
The next interest rate increase cycle was in 1999 to 2000. In this case both CPI and bank lending followed the fed funds increase. This is exactly opposite of what typical economics professors tell you will happen.
The last case is from the interest rate increase from 2003-2006. Here bank lending followed the rate rise and the CPI did increase but then ran out of steam. After this chart we had the great recession and housing collapse.

After the collapse, in 2009 the Fed took rates to zero and kept them there until 2015. Lenders and borrowers became accustomed to these low rates. Since 2016 tightening on rates started.
The other major change over the past few decades, is the Fed now tends to flash bold signs as to their next moves. This is amplified with Wall Street. The Fed has stated “we are going to raise rates since there is going to be inflation.” Once this is telegraphed the public believes that yes, indeed inflation is coming. So, we should see CPI heat up but Fed increases have a bit to go before these become punitive. The Fed is also going to work to tighten money by taking out $30 billion per month from the system. In July this goes to $40 billion and in October this goes to $50 billion. Taking these funds out of the market will create some headwinds for the market.
It will be interesting to see if people think inflation is coming, how will they respond? Will they jump in to spend and borrow more before things get worse as they have in the past? Or will they follow the standard economic textbook?
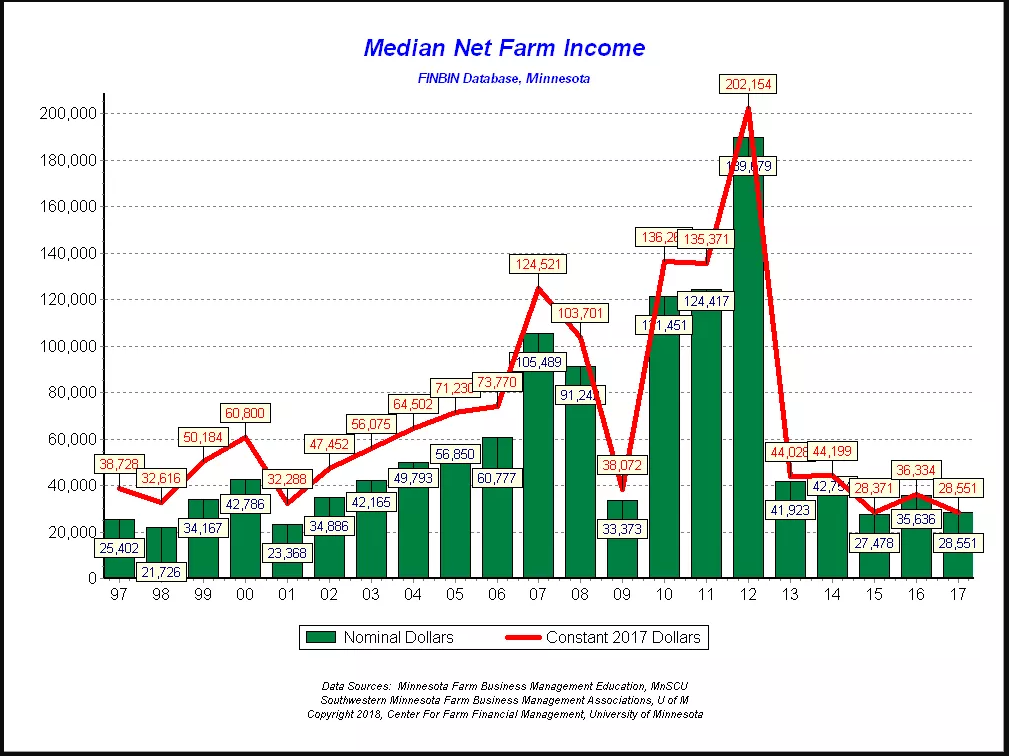
Quick Bite: One of the areas that is hurting in the economy today is farming. Most of us who are in ag lending know that prices spiked around five years ago and family farm income has dropped severely. This bonus chart is from the FINBIN database of median net farm income in Minnesota. If this continues, we will begin to see weaker farmers get out.